K‑12 Institutional Platforms
Snippet summary: K‑12 institutional platforms are school and district systems for instruction, student data, curriculum alignment, and compliance; they are the data backbone of K‑12 education with strong policy dependence and rising AI‑driven personalization demand.
System path: Public Intelligence Systems / EdTech / K‑12 Institutional Platforms
Related pages: All EdTech segments · Glossary · Policy & Regulation
Executive Summary
K‑12 institutional platforms are the operational and pedagogical backbone of modern school systems, covering LMS, SIS, curriculum alignment, analytics, and compliance. The segment is structurally important because it controls data flows, compliance mandates, and learning outcomes, creating deep switching costs and long‑cycle procurement dynamics. Market growth is driven by hybrid learning normalization, AI‑enabled personalization, and policy mandates (ESSA, FERPA, NEP 2020), while headwinds include funding uncertainty and vendor consolidation pressure.^1^3
Decisions this analysis should inform:
- Whether to prioritize LMS, SIS, or analytics layers for defensibility
- How to position against open‑source and government platforms (e.g., DIKSHA/NDEAR)
- Which policy and funding signals indicate procurement tailwinds
- Where AI capabilities create structural advantage vs. commodity features
Scope & Definition
In Scope
- Learning Management Systems (Canvas, Google Classroom, Schoology, Blackboard)
- Student Information Systems (PowerSchool, Infinite Campus, Ellucian)
- Curriculum planning, assessment, and analytics tools
- AI‑powered personalization and teacher workflow automation
- Government or district‑wide platforms (DIKSHA, NDEAR)
Out of Scope
- Direct‑to‑consumer tutoring or test prep
- Hardware/devices (tablets, smartboards)
- Non‑mandated enrichment platforms
- Higher‑education platforms
Systemic Importance
Institutional platforms determine data governance, compliance, and instructional control. Vendors that own the integration layer capture adjacent services (analytics, parent engagement, attendance, reporting) and become embedded infrastructure for districts.
Market Sizing & Growth
Global & US Outlook
| Metric | 2024 | 2025 | 2030–2034 | CAGR | Source |
|---|---|---|---|---|---|
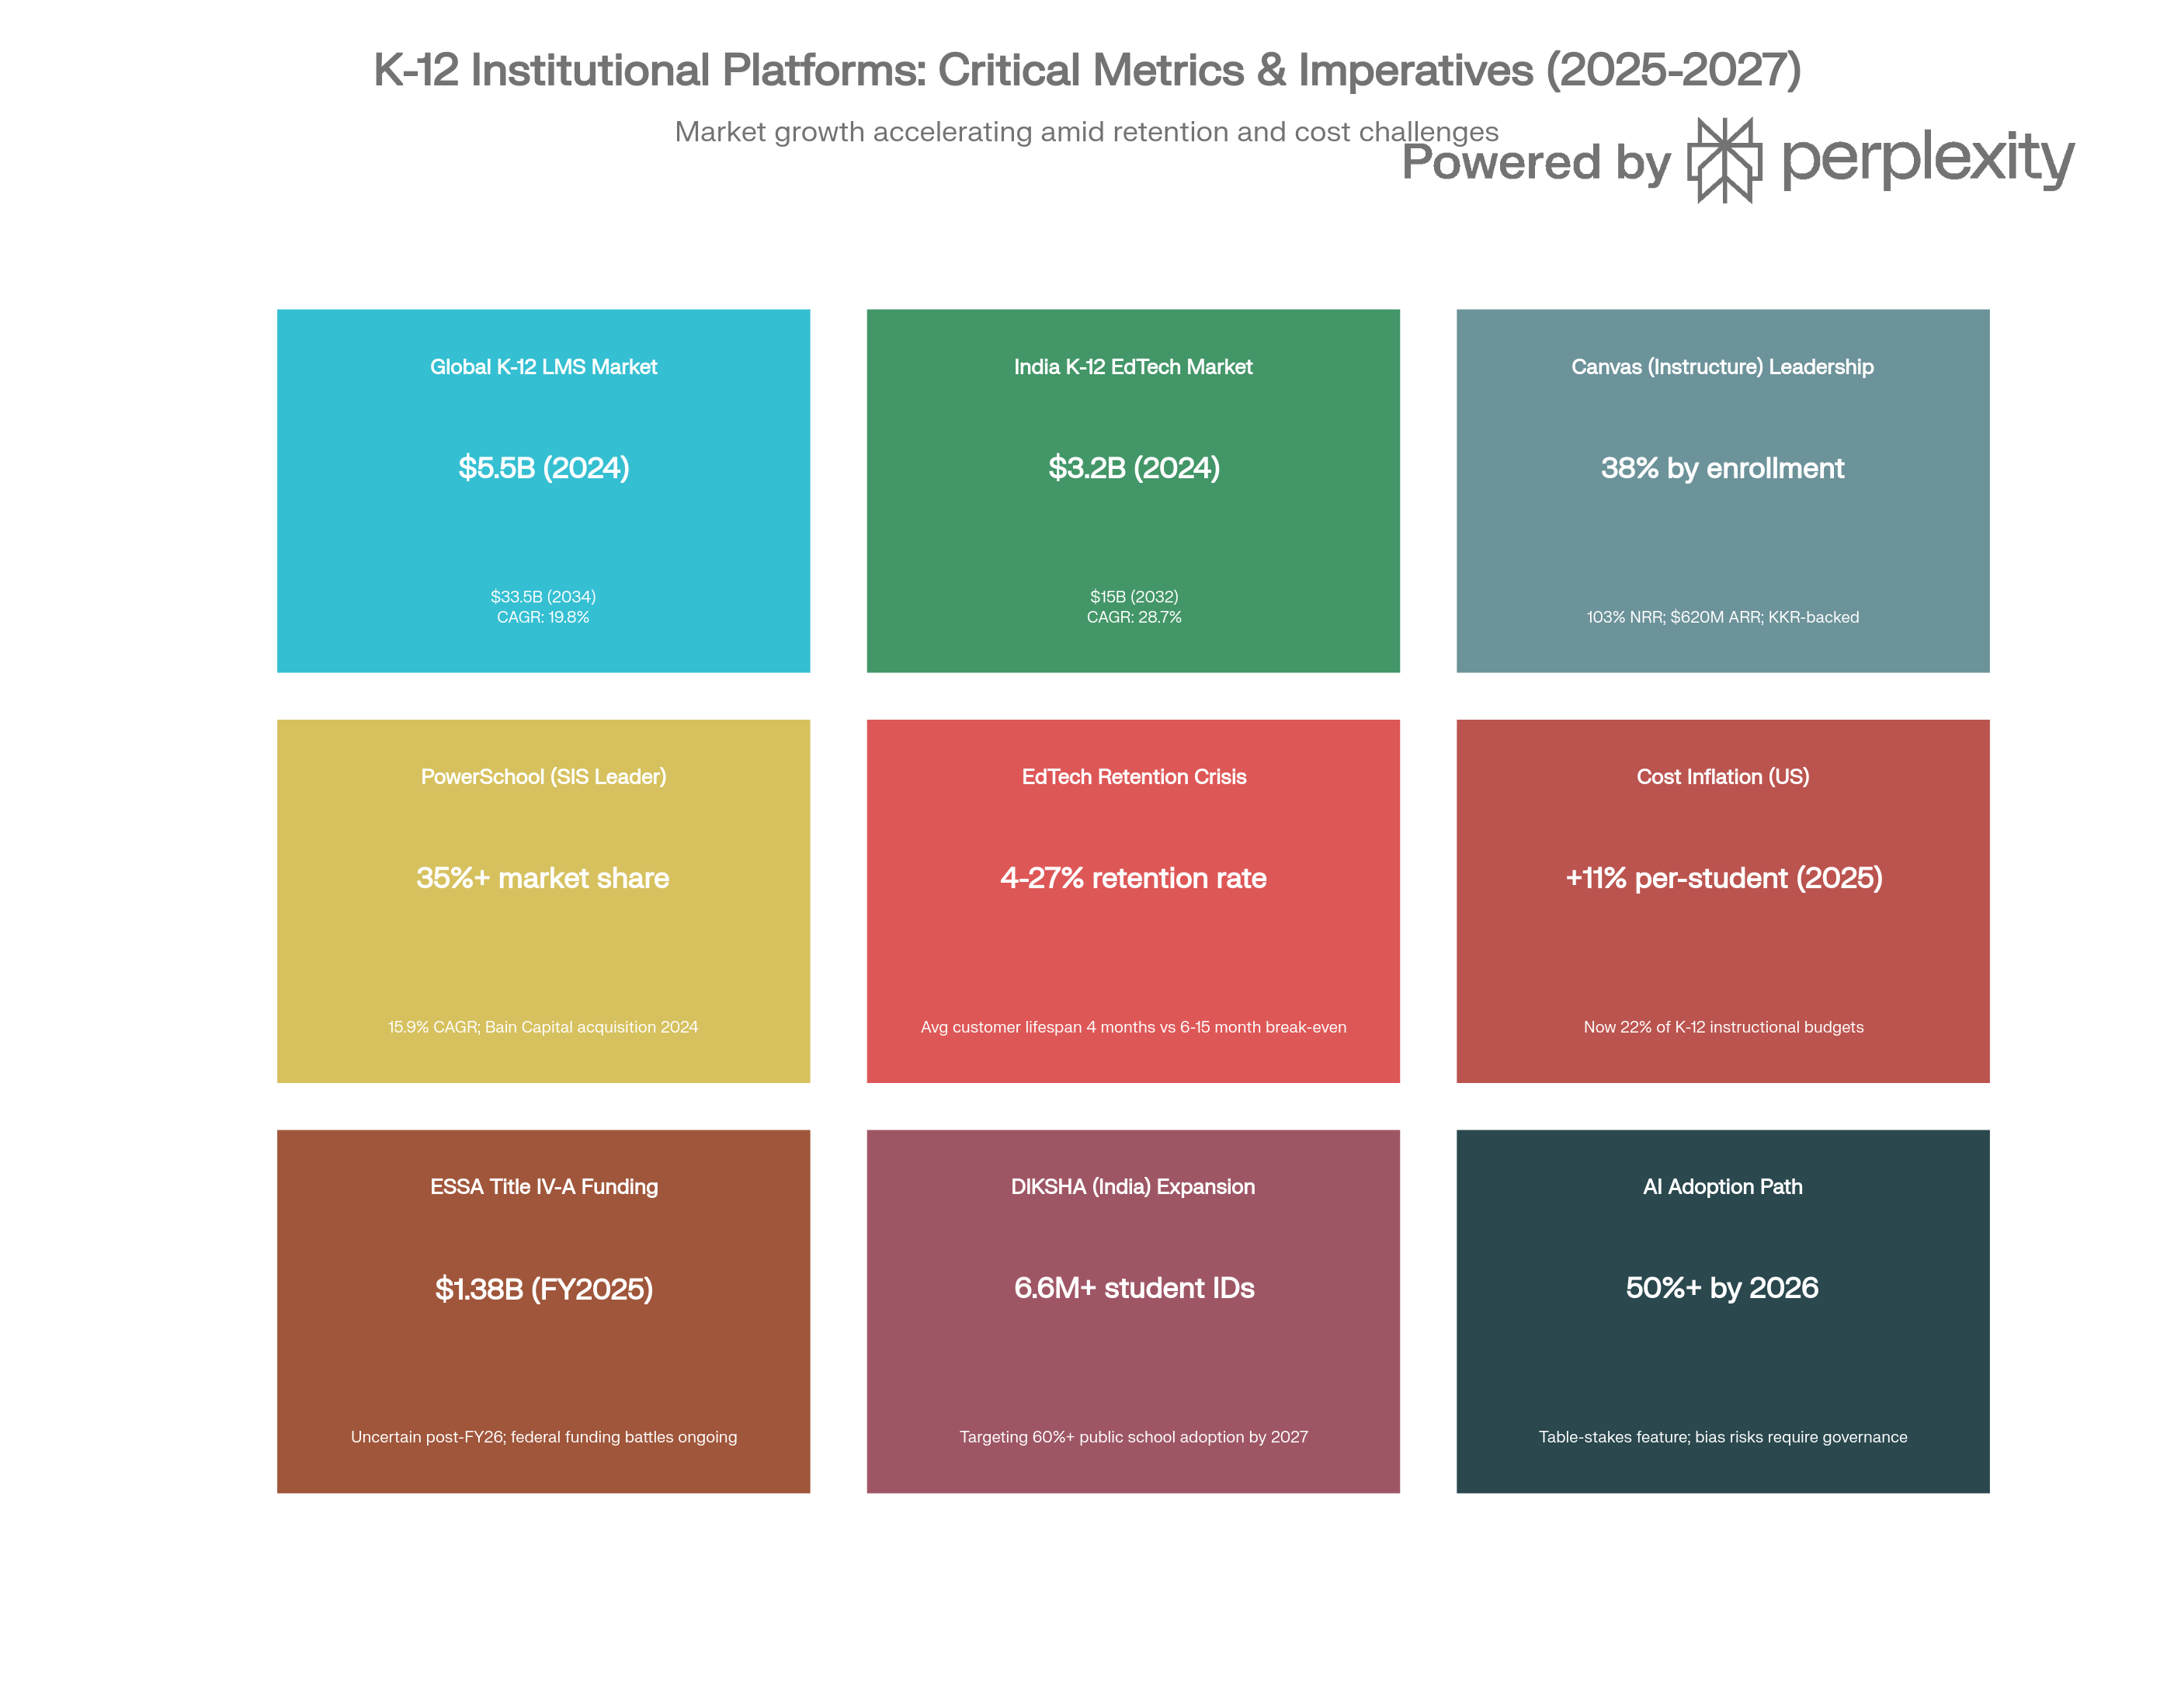
| Global K‑12 LMS | $5.5B | $6.8B | $33.5B (2034) | 19.8% | ^4 |
| Global LMS (all sectors) | $23.35B | $26.69B | $89.66B (2032) | 18.9% | ^5 |
| K‑12 SIS Market | $15.33B | – | $32.04B (2029) | 15.9% | ^6 |
| Global SIS Market | $13.2B | – | $22.3B (2030) | 8.1% | ^7 |
North America accounts for ~36% of global K‑12 LMS spend, driven by hybrid learning mandates, ESSA Title IV‑A funding, and AI‑enabled personalization.[^1][^8] 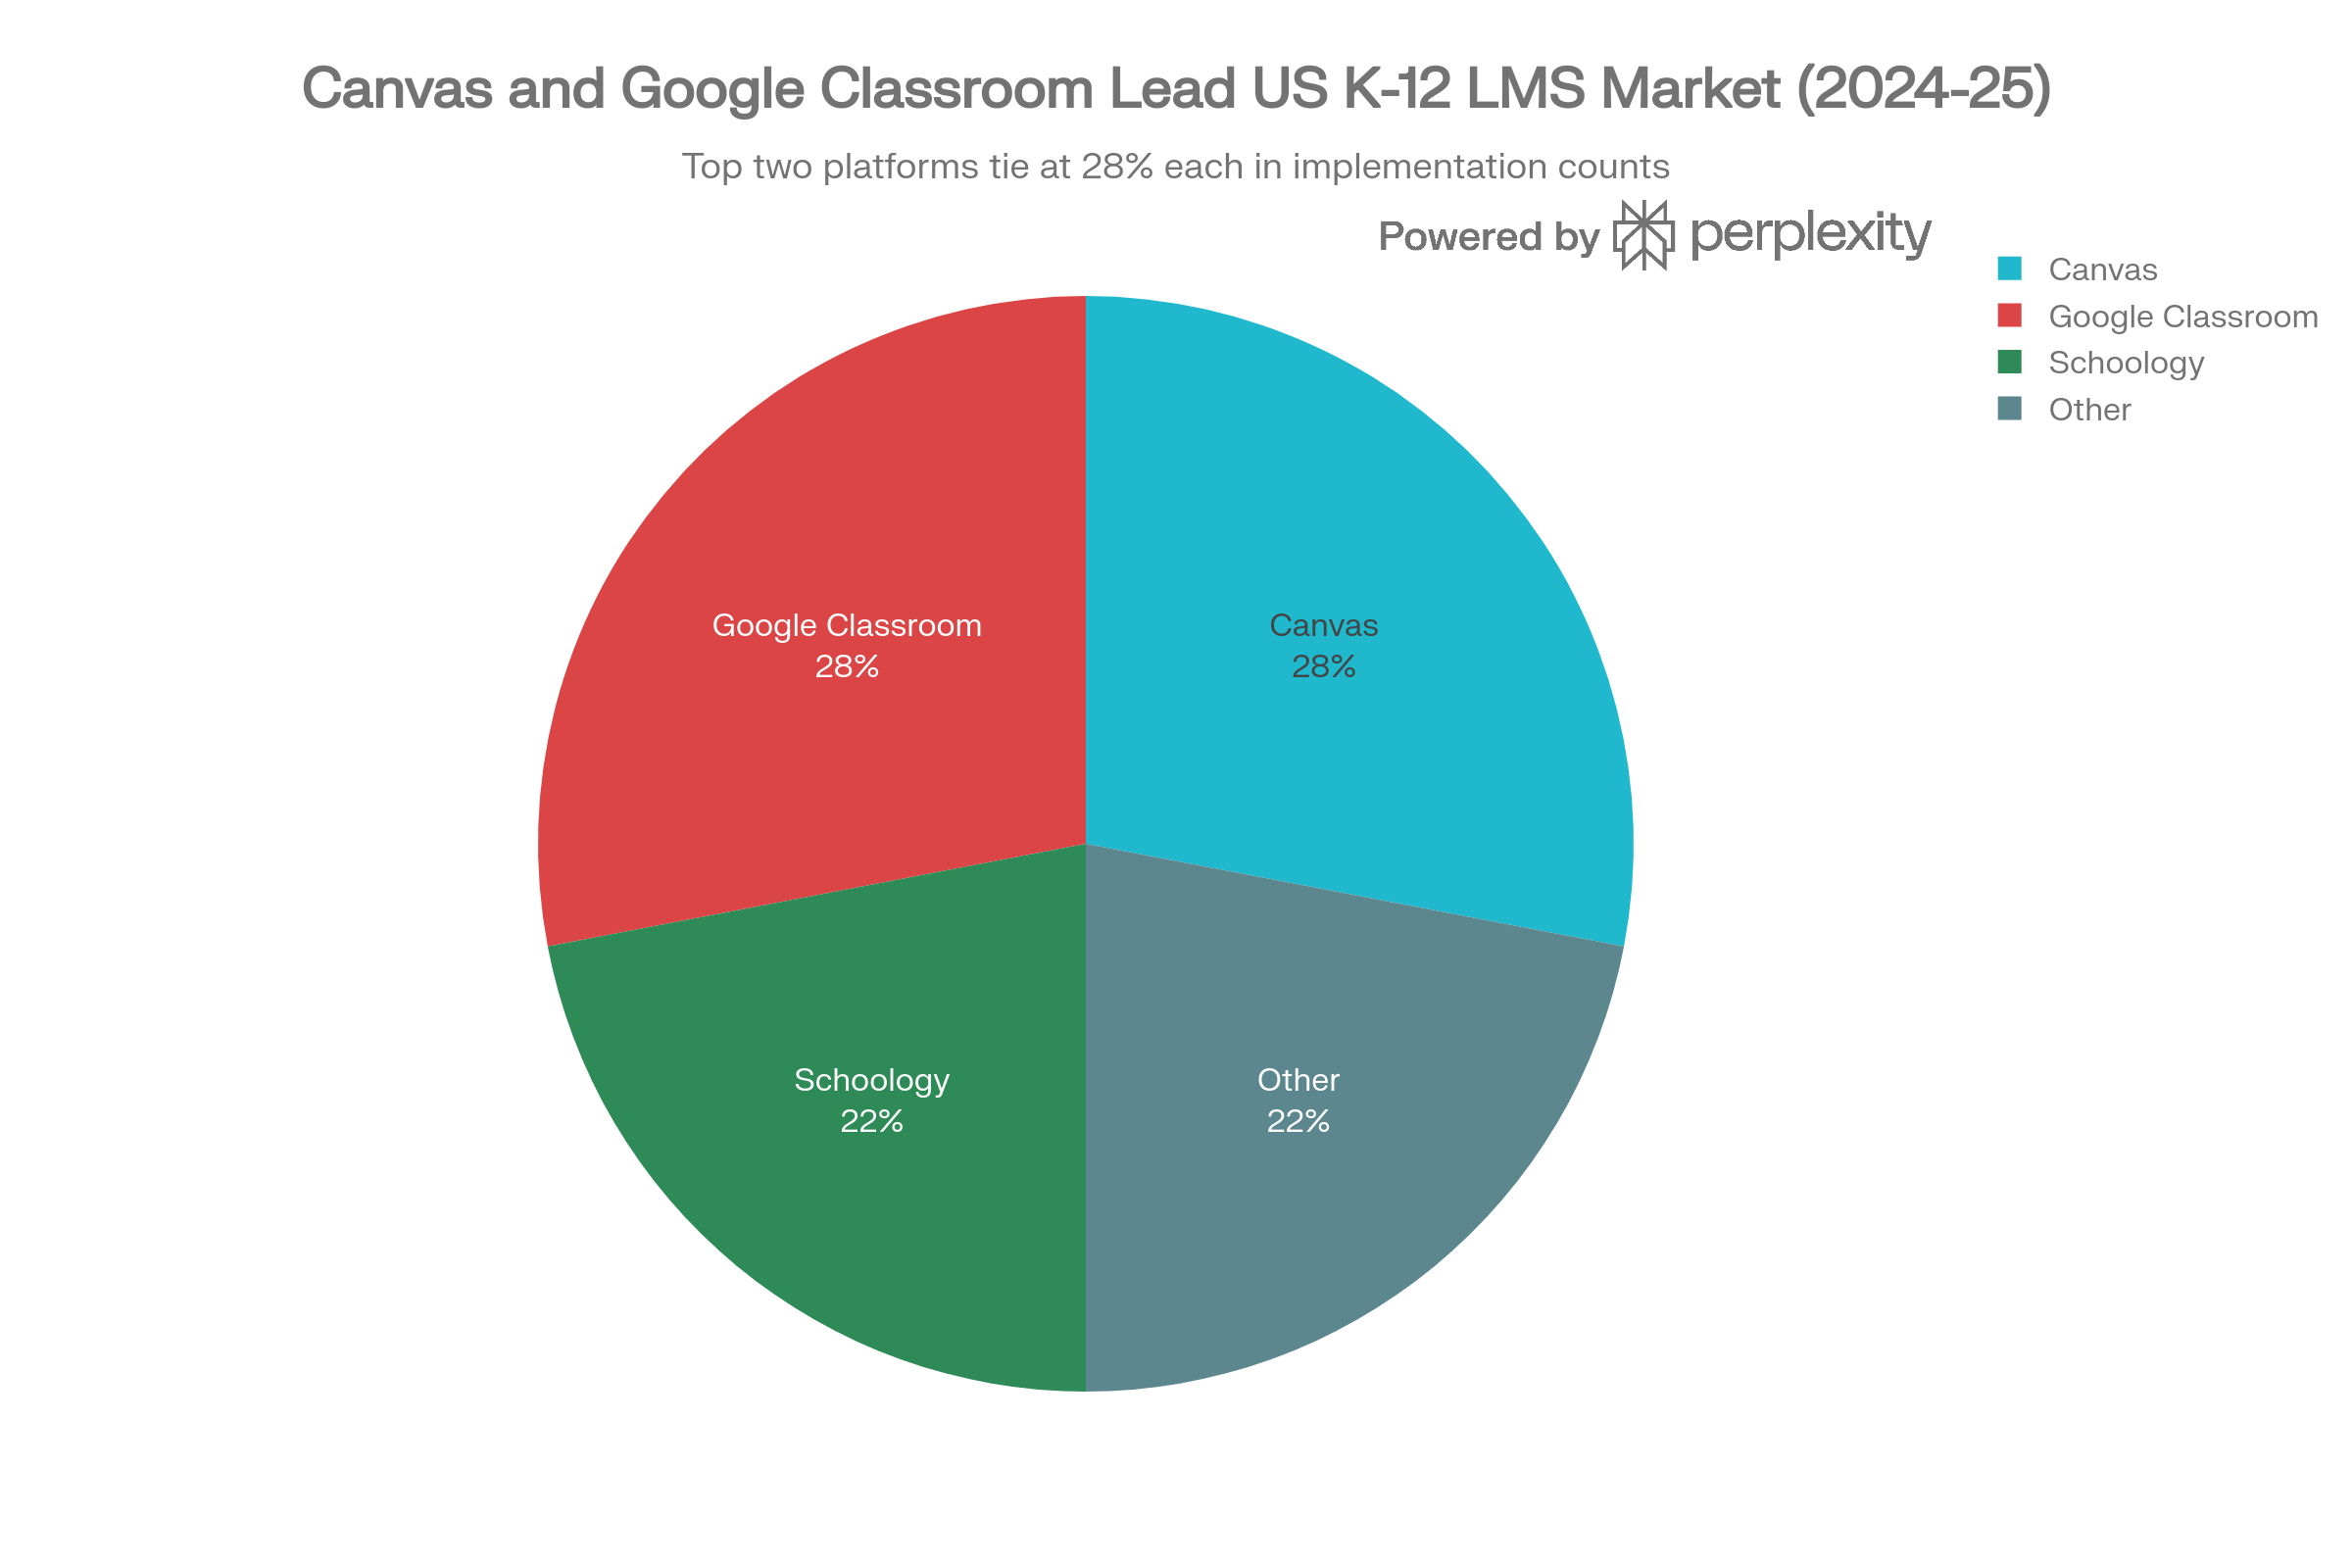
Headwinds: budget constraints, vendor consolidation driving per‑student fee inflation (~11% in 2025), and retention churn (4–27%).
India Outlook
| Metric | 2024 | 2025 | 2032 | CAGR | Source |
|---|---|---|---|---|---|
| India EdTech Market | $2.8B | $3.63B | $33.31B | 27.94% | [^9] |
| K‑12 Institutional (standalone) | $3.2B | – | $15B | 28.71% | [^10] |
| K‑12 Education Market (total) | $133.7B | – | $341.6B | 16.9% | [^11] |
Institutional penetration remains ~30% (vs. ~90% in the US), creating long‑run whitespace as NEP 2020 and NDEAR standards mature.[^12]
Key Players & Competitive Positioning

United States
Canvas (Instructure)
- 38% market share by enrollment; $620M ARR (2024)
- 103% NRR; KKR acquisition ($4.8B, 2024)
PowerSchool
- 35%+ SIS share; Bain acquisition ($5.6B, 2024)
- AI roadmap via PowerBuddy
Google Classroom
- 28% implementation share; freemium advantage; deep Google Workspace integration
Schoology (Anthology/Blackboard)
- 22% implementation share; Chapter 11 uncertainty (2025)
India
DIKSHA (Govt)
- 6.6M+ provisional IDs; 300K+ OER resources; AI‑enabled DIKSHA 2.0 (2025)
NDEAR (Govt)
- Federated interoperability layer; Sunbird open‑source architecture
Institutional startups
- Teachmint, Extramarks, Vedantu (institutional pivot)
Unit Economics & Retention
US Institutional Economics
| Metric | Range | Notes |
|---|---|---|
| Per‑student ARPU | $5–$15/month | Districts spend $50K–$500K annually |
| CAC (EdTech) | $806–$1,617 | High sales cost in district procurement |
| LTV (benchmark) | $7,100 | LTV/CAC ~5x |
| Payback period | 6–15 months | Must recover before churn |
| Retention | 4–27% | Category‑wide weakness; Canvas is outlier |
India Institutional Economics (Estimated)
| Metric | Range | Notes |
|---|---|---|
| Per‑student ARPU | ₹50–₹300/month | 10–20x lower than US |
| School annual fee | ₹2.4L–₹24L | Private school mid‑market |
| CAC (estimated) | ₹20K–₹50K | Relationship‑driven sales |
| LTV (estimated) | ₹10L–₹50L | 3–5 year contracts |
| Payback period | 6–12 months | Higher volatility in govt schools |
AI Impact Analysis
Efficiency Gains
- Automated assessment reduces grading time 40–50%.
- Predictive risk analytics identify at‑risk students earlier (Schoolzilla, PowerSchool Analytics).
- Classroom orchestration suggests instructional pivots based on live response data.
Structural Shifts
- Personalized learning pathways enable competency‑based progression.
- Outcome prediction + intervention improve retention and graduation probability.
New Risks
- Algorithmic bias (5–15% accuracy gaps) amplifies inequity.
- Privacy and surveillance concerns expand compliance burden.
- Academic integrity risks accelerate as AI writing tools proliferate.
Regulatory & Policy Landscape
United States
- ESSA Title I‑A and Title IV‑A funding shape procurement cycles.[^1][^8]
- FERPA and COPPA govern data usage and consent.
- Funding volatility (unspent ESSER, FY26 cut proposals) creates demand uncertainty.
India
- NEP 2020 mandates digital pedagogy and competency‑based assessment.
- NDEAR standardizes interoperability and reduces vendor lock‑in.
- Infrastructure gaps persist across states; PPP models expanding.
Capital Stack & M&A Patterns
United States
- KKR / Instructure ($4.8B, 2024)
- Bain / PowerSchool ($5.6B, 2024)
- Anthology Chapter 11 (2025)
Valuation compression: Instructure EV/ARR compressed from 14.5x (2021 IPO) to 7.7x (2024).
India
- Teachmint (Series B, 2022)
- Vedantu institutional pivot + funding (2024)
Predictions & Futures (2025–2029)
- LMS consolidation: Top 3–4 vendors control 65%+ by 2027 (High).
- AI personalization becomes table‑stakes by 2026 (High).
- DIKSHA/NDEAR adoption accelerates to 60%+ public schools by 2027 (High).
- SIS pricing power remains durable despite budget pressure (High).
- Retail EdTech pivots to institutional to reach 30% B2B mix by 2028 (Medium).
What Breaks / Converges / Commoditizes
Breaks: Single‑vendor LMS dominance; legacy data architectures.
Converges: LMS + SIS + analytics into unified stacks; assessment + personalization workflows.
Commoditizes: Basic LMS features, video conferencing, generic AI writing tools.
FAQs
What is included in K‑12 institutional platforms?
LMS, SIS, curriculum alignment, classroom workflow tools, and district‑level systems of record.
What is excluded from this segment?
Direct‑to‑consumer tutoring, test prep outside school mandates, and hardware devices.
Who are the leading institutional platform providers?
In the US: Canvas, PowerSchool, Google Classroom, Schoology. In India: DIKSHA, NDEAR ecosystem, Teachmint, Extramarks.
What drives market growth?
Hybrid learning normalization, policy funding (ESSA/NEP), and AI‑enabled personalization.
Curated Research & Sources
| Source | Publisher | Key Finding | SQI | Annotation |
|---|---|---|---|---|
| K‑12 LMS Market | Market.us | $33.5B by 2034 | A | Global K‑12 LMS baseline |
| LMS Market | Coherent Market Insights | $89.66B by 2032 | A | Broader LMS growth context |
| K‑12 SIS Market | MarketsandMarkets | $32.04B by 2029 | A | SIS growth trajectory |
| India EdTech Market | IMARC | $33.31B by 2032 | A | India market anchor |
| DIKSHA Overview | Govt/NCERT | Platform scale + governance | B | Govt platform context |
| ESSA Funding | US Dept. of Education | Policy funding driver | A | Regulatory baseline |
References
Show full reference list
- https://market.us/report/k-12-learning-management-systems-market/
- https://www.coherentmarketinsights.com/market-insight/learning-management-system-market-594
- https://www.grandviewresearch.com/horizon/statistics/learning-management-system-market/academic/k-12/global
- https://www.marketsandmarkets.com/Market-Reports/student-information-system-market-21151415.html
- https://www.imarcgroup.com/india-edtech-market
- https://www.grandviewresearch.com/horizon/outlook/k-12-education-market/india
- https://www.listedtech.com/blog/the-state-of-the-lms-market-in-2024-trends-in-k-12/
- https://www.insidearbitrage.com/2024/07/kkr-to-acquire-instructure-holdings-in-a-4-8-billion-all-cash-deal/
- https://www.saastr.com/5-interesting-learnings-from-instructure-at-620000000-in-arr/
- https://www.baincapital.com/news/powerschool-be-acquired-bain-capital-56-billion-transaction
- https://listedtech.com/blog/anthologys-chapter-11/
- https://www.roombr.com/blog/digital-classroom-govt-initiatives-india
- https://en.wikipedia.org/wiki/Digital_Infrastructure_for_Knowledge_Sharing
- https://www.ndear.gov.in/images/pdf/NDEAR Main Report_July%2026_210728_194926.pdf
- https://www.ed.gov/laws-and-policy/laws-preschool-grade-12-education/every-student-succeeds-act-essa
- https://learningpolicyinstitute.org/blog/5-billion-federal-k-12-formula-funding-hangs-balance-between-white-house-and-senate-proposals
- https://cdn.iste.org/www-root/[2020 UPDATES] USING ESSA TO FUND EDTECH.pdf
- https://www.ffyf.org/policy-priorities/essa/
- https://www.powerschool.com/blog/tips-to-fund-k12-data-analytics-mtss-edtech/
- https://www.ndear.gov.in/images/pdf/NDEAR-Ecosystem Policy-Version.pdf
- https://educationforallinindia.com/digital-infrastructure-in-schools-challenges-and-progress-in-india/
- https://www.hurix.com/blogs/effective-ways-of-personalized-learning-with-ai-in-k12-education/
- https://pmc.ncbi.nlm.nih.gov/articles/PMC8455229/
- https://czasopisma.marszalek.com.pl/uploads/periodicals/tner/2025/tner8102.pdf
- https://www.ed.gov/sites/ed/files/documents/ai-report/ai-report.pdf
- https://www.sreb.org/sites/main/files/file-attachments/2025_ai_in_k-12classroom_guidance.pdf?1744905120
[^8]: https://cdn.iste.org/www-root/[2020 UPDATES] USING ESSA TO FUND EDTECH.pdf [^9]: https://www.imarcgroup.com/india-edtech-market [^10]: https://sscbs.du.ac.in/wp-content/uploads/2025/09/EdTech-Industry-Report.pdf [^11]: https://www.grandviewresearch.com/horizon/outlook/k-12-education-market/india [^12]: https://www.ndear.gov.in/images/pdf/NDEAR Main Report_July%2026_210728_194926.pdf