BCG Matrix for Value-Driven Consulting
The Boston Consulting Group’s growth/share matrix is twelve-year-old MBA candy, but when paired with GrowthFlowEngineering’s ValuationOps charts and Align rituals, it still slices strategic ambiguity like a precision knife.
1. What It Is (definition + quick signal)
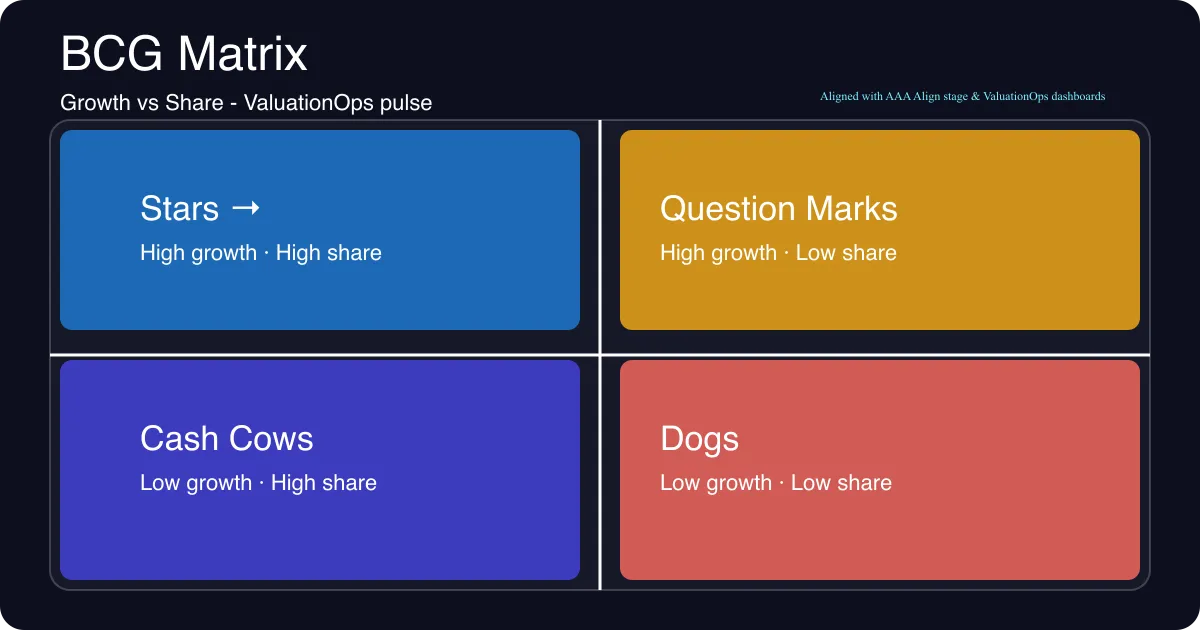
The BCG matrix places every business unit or product line into one of four quadrants based on market growth (vertical axis) and relative market share (horizontal axis). It’s a quick pulse check on whether something is a cash-gulping question mark or a generating cash cow.
Why we care: it’s not a forecasting tool—it’s a portfolio thermobarometer. When the share axis moves fast or the growth curve shifts, the matrix lets GrowthFlowEngineering signal when to invest, when to harvest, and when to call for a reassess.
2. Wit & Analogy
Think of your portfolio as a comedy improv troupe audition. The Stars are the charismatic headliners with original bits (high growth + high share). The Cash Cows are the veteran props masters who keep shows funded. The Question Marks are the new rookies with weird ideas; they might be breakout stars or they might flop. The Dogs are that one prop nobody touches.
Our twist: the AI co-producer (hello, gemini-proxy) watches the crowd for applause signals (value logs, sentiment, conversion spikes) and whispers reminders when a question mark is about to become a star—or when a dog just needs a dignified exit.
3. Framework Walkthrough
| Quadrant | What it represents | ValuationOps signal | Micro-story |
|---|---|---|---|
| Stars | High-growth markets where you already dominate share. | GrowthOps dashboards scream — “beat +25% MoM ARR”. | ValuationOps sees a product line with 3x pipeline velocity; we keep doubling the adoption sprint to keep momentum before margin pressure sets in. |
| Cash Cows | Mature offers with steady cash but low growth. | EBITDAOps reports show 60%+ gross margin and stable volume. | We treat this like a stabilizer: automate delivery flows, tighten pricing guardrails, and use freed-up bandwidth to fund the next star. |
| Question Marks | High growth but low share; expensive to scale. | RevenueOps track rising customer acquisition cost (CAC) versus lifetime value (LTV). | We run a micro-experiment (value log + LEOtag) to see if AI upsell nudges the share needle before committing more spend. |
| Dogs | Low share, low growth—keep, divest, or retool. | StoryOps flags shrinking narrative resonance and rising churn. | GrowthFlowEngineering either retires the capability or repositions its IP for a different persona (e.g., repositioning a legacy analytics tool as a compliance dashboard). |
4. Real-world Examples
- RevenueOps: We mapped the payment gateway bundle to the Stars quadrant. It already had high share in Europe, so we used ValuationOps dashboards to channel AI-powered customer scoring and keep it from slipping into Question Mark risk.
- Marketing & Sales: A personalization engine lived in Question Marks. After we layered an AI feedback loop and nudged the LTV/CAC ratio, it graduated to Star status inside 90 days—while we documented the experiments on ValueLogs with LEOtags for learning.
- Counter-example: A compliance reporting product lingered in Dogs for two quarters because leadership mistook low growth for low importance. Reframing it as a backend compliance backbone (billing it as an efficiency play) moved it back into the Cash Cow panel.
5. Limitations & Pitfalls
- Time blind: The matrix works on a single snapshot; it doesn’t model momentum or timing—ValuationOps needs trend lines, not just quadrants.
- Share obsession: Leaders can chase Stars even when margins are negative. Tie every quadrant conversation back to a clear financial thesis, not just glib positioning.
- Data quality: If the “relative market share” axis is modeled off bad GTM data, all four quadrants are garbage. GFE always pairs this with a quick Data Health pulse during Audit.
- Capability readiness: The matrix ignores whether people can execute. That’s why AAA’s Align stage overlays readiness scores on every quadrant move.
6. GFE Playbook Mapping
- ValuationOps – Quadrant assignments feed the valuation spreadsheet: Stars drive revenue growth forecasts, Cash Cows fund automation reserves, Question Marks get mini-capital requests, and Dogs carry weighted risk adjustments. MVP dashboards surface the quadrant trends alongside ValueLog LEOtags so leaders see human intent + AI signal together.
- AAA – Align loves the BCG matrix. After Audit uncovers the data story, Align pairs the portfolio with capability readiness, and Automate builds the workflows that either defend Stars or retire Dogs responsibly. Think of the matrix as Align’s “which bets do we prioritize?” radar.
7. Takeaways / Call to Action
- Audit Your Portfolio: Don't just list products. List internal tools and processes. Tie the quadrants to actual KPI dashboards (ARR velocity, gross margin, StoryOps resonance).
- Run a ValueLog entry for the quadrant shift you expect this quarter—note the signal, the action, the AI or human guardrail you choose.
- Prompt gemini-proxy: “In one paragraph, explain how a hypothetical AI-powered revenue stream would move through the BCG matrix and which ValuationOps KPI changes prove it.”
How to Apply This Today
- Audit Your Forecast: Look at your last 3 quarters. What was the variance? If >10%, you have a process problem, not a math problem.
- Run a ValueLog entry for the quadrant shift you expect this quarter—note the signal, the action, the AI or human guardrail you choose.
- Prompt gemini-proxy: “In one paragraph, explain how a hypothetical AI-powered revenue stream would move through the BCG matrix and which ValuationOps KPI changes prove it.”
8. Media & Embeds
- Keep the hero illustration inside the post via a
<figure>block so readers can see the quadrants while they read the narrative. Replace the image path (/images/blog/bcg-matrix-hero.webp) with any refreshed visual when you update the media. - If there is an accompanying YouTube video, embed it like this (replace
VIDEO_ID):
<div style="position:relative;padding-bottom:56.25%;height:0;overflow:hidden;">
  <iframe src="https://www.youtube.com/embed/VIDEO_ID" title="BCG Matrix Explainer" frameborder="0" allow="accelerometer; autoplay; clipboard-write; encrypted-media; gyroscope; picture-in-picture" allowfullscreen
    style="position:absolute;top:0;left:0;width:100%;height:100%;">
  </iframe>
</div>- Align the video caption/copy with ValuationOps or AAA so the multimedia stays consistent with GrowthFlowEngineering’s voice.
8. Publication & Automation Notes
- Use the template-friendly sections above as headings so agents can riff on other frameworks (replace “BCG” with the new frame and keep the intent bullet list).
- Hero image: drop a minimal, high-contrast BCG grid (or similar quadrant illustration) into
docs/public/images/blog/as WebP (<200 KB). For now we’re using the Unsplash URL; replace it when you have a bespoke visual. - Update
docs/.vitepress/theme/blog-data.jswith the new post entry (done) and runnpm run sort:blogs+npm run generate:blog-sitemapbefore release so the list and sitemap stay in sync. - Agents can duplicate this file, swap in the new framework name, tweak the analogy, and rerun the automation scripts listed above before publishing.