Law 9: Bounce-Back Time Determines Resilience
The Law in One Sentence
Resilience isn't measured by how rarely you fail—it's measured by how fast you recover. Bounce-back time is the competitive moat.
Why This Law Matters
Most organizations obsess over preventing failure. They build redundancy, add checks, create approval layers—all to make sure nothing goes wrong.
Law 9 flips this: The goal isn't zero failures. The goal is fast recovery.
Why? Because in
any complex system (which includes every growing business), failure is inevitable. The question isn't if something will break—it's how quickly you can fix it when it does.
Companies with low bounce-back time:
- Ship faster (because they're not paralyzed by fear of breaking things)
- Learn faster (because they get feedback loops from failures)
- Outcompete slower rivals (because they're back online before competitors even detect the issue)
Companies with high bounce-back time:
- Ship slower (because every change is terrifying)
- Stagnate (because they avoid experimentation)
- Lose market share (because customers defect during prolonged outages)
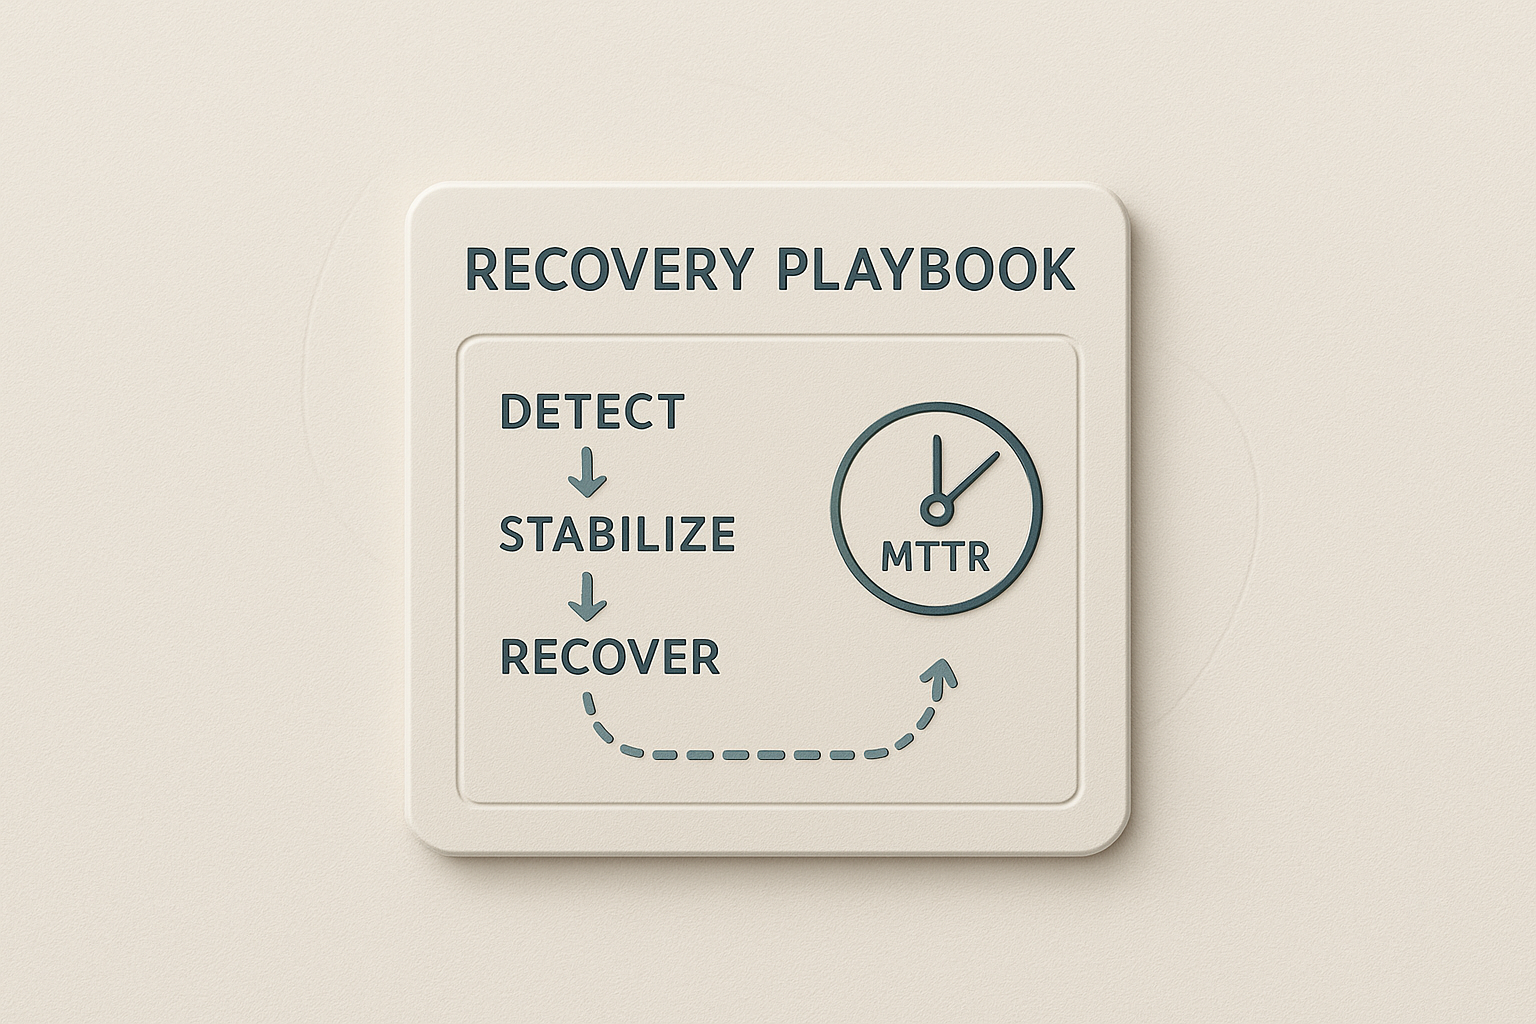
Bounce-back time is Mean Time to Recovery (MTTR): the average time from "something broke" to "it's fixed."
Low MTTR = High Resilience. High MTTR = Fragility.
The GFE Interpretation
The Resilience Equation
In GFE, we model resilience as:
Resilience = 1 / Bounce-Back Time
The faster you recover, the more resilient you are. The formula is inversely proportional—halving your recovery time doubles your resilience.
Why Bounce-Back Time Beats Uptime
Traditional metrics focus on uptime percentage: "We have 99.9% uptime!"
But this is misleading. Here's why:
- 99.9% uptime = 8.76 hours of downtime per year
- 99.99% uptime = 52.6 minutes of downtime per year
Both sound great. But the real question is: When those 8 hours (or 52 minutes) hit, how long does each incident last?
Scenario A: You have 100 incidents per year, each lasting 5 minutes. Total downtime: 8.3 hours (99.9% uptime). MTTR: 5 minutes.
Scenario B: You have 2 incidents per year, each lasting 4 hours. Total downtime: 8 hours (99.9% uptime). MTTR: 4 hours.
Both companies have the same uptime. But Company A has 48x faster bounce-back (5 min vs 4 hrs).
Which company is more resilient? Company A. Because when they fail, customers barely notice. Company B's failures are catastrophic.
The Four Levers of Bounce-Back Time
To reduce bounce-back time, optimize these four stages:
1. Detection Time (Time to Know)
How fast do you realize something is broken?
- Bad: Customers report the issue via support tickets (hours).
- Good: Monitoring alerts fire automatically (seconds).
Action: Build Proof systems that surface failures instantly.
2. Diagnosis Time (Time to Understand)
How fast can you identify the root cause?
- Bad: Engineers dig through logs manually, guessing at causes (hours).
- Good: Automated dashboards show exactly what changed and where (minutes).
Action: Instrument your Flows with observable checkpoints.
3. Resolution Time (Time to Fix)
How fast can you deploy a fix?
- Bad: Must wait for approval, run tests, schedule deploy window (days).
- Good: Rollback or hotfix deployed automatically via CI/CD (minutes).
Action: Automate deploy and rollback (AAA Loop).
4. Verification Time (Time to Confirm)
How fast can you confirm the fix worked?
- Bad: Wait for customer reports to stop coming in (hours).
- Good: Automated health checks confirm recovery (seconds).
Action: Build real-time dashboards tied to KPIs.
Total MTTR = Detection + Diagnosis + Resolution + Verification
The companies that dominate optimize all four.
The Underlying Physics of the Law
1. The Availability Paradox
Ironically, teams that obsess over preventing failures often have worse MTTR. Why? Because they avoid practicing recovery. When a failure finally happens (and it will), they panic. They have no muscle memory for fixing things fast.
Teams that embrace failure as inevitable practice recovery constantly. They run chaos engineering drills, simulate outages, and build tooling for fast rollback. When a real failure hits, they're calm and efficient.
2. The Feedback Loop Differential
Bounce-back time determines your learning velocity. If you recover in 5 minutes, you can experiment, fail, fix, and try again 12 times in an hour. If you recover in 4 hours, you get 2 iterations per day.
Fast bounce-back = 60x more learning cycles. Over a year, that compounds into an insurmountable competitive advantage.
3. The Customer Patience Threshold
Research shows customers tolerate brief, frequent outages better than rare, prolonged ones. A 30-second blip? Annoying, but forgivable. A 4-hour outage? They're evaluating competitors.
Bounce-back time determines whether a failure is a minor inconvenience or an existential threat.
Evidence from Research
MTTR directly impacts business value: Studies show downtime can cost businesses over $300,000 per hour, with costs reaching $5 million/hour in sectors like healthcare and banking. Low MTTR minimizes these losses and protects revenue.
Fast recovery drives competitive advantage: Organizations with strong resilience (low bounce-back time) can outmaneuver competitors, especially during volatile markets. Fast recovery allows businesses to maintain quality, protect reputation, and capitalize on opportunities that emerge during crises.
Preparedness reduces recovery time: Resilient organizations that proactively identify risks and develop contingency plans recover significantly faster when disruptions occur. This preparedness—combined with agile systems and strong leadership—enables swift problem-solving and minimizes prolonged disruptions.
How This Law Transforms Execution
Applying Law 9 changes how teams think about risk and failure.
Before Law 9:
- Engineer: "We can't ship this—what if it breaks?"
- Manager: "Let's add 3 more approval checkpoints."
- Result: Ship velocity slows to a crawl.
After Law 9:
- Engineer: "If this breaks, how fast can we roll back?"
- Manager: "We have automated rollback and real-time monitoring. MTTR is 2 minutes. Ship it."
- Result: High velocity + low risk.
Case Example: The "5-Minute Deploy vs 5-Day Deploy"
Context: Two e-commerce companies, both with similar revenue ($50M ARR). Both experience a critical bug in their checkout flow during Black Friday.
Company A (High MTTR):
- Detection: Customers report checkout failures. Takes 30 minutes for support to escalate to engineering.
- Diagnosis: Engineers manually review logs. Takes 1 hour to identify the bug.
- Resolution: Must request emergency deploy approval from CTO. Wait for manual QA. Deploy window scheduled for 4 hours later. Total: 6 hours.
- Verification: No automated health checks. Wait for support tickets to stop. Total: +2 hours.
Total MTTR: 8 hours.
Impact: Lost $2.4M in sales (8 hours of peak Black Friday traffic). 15% of customers abandoned carts and bought from competitors.
Company B (Low MTTR):
- Detection: Automated monitoring detects checkout failure spike. Alert fired in 30 seconds.
- Diagnosis: Pre-built dashboard shows recent deploy correlation. Root cause identified in 2 minutes.
- Resolution: Automated rollback triggered. Previous stable version re-deployed in 3 minutes.
- Verification: Automated health checks confirm recovery in 30 seconds.
Total MTTR: 6 minutes.
Impact: Lost $30K in sales (6 minutes of downtime). Customer impact undetectable. No reputation damage.
The Difference: 8 hours vs 6 minutes = 80x faster bounce-back.
Company B's competitive advantage isn't that they never fail—it's that when they do, customers don't even notice.
How to Apply This Law Today
- Measure Your Current MTTR: Track the last 10 incidents. Calculate average time from failure to recovery. If you don't track this, start now.
- Identify Your Slowest Lever: Is it Detection? Diagnosis? Resolution? Verification? Focus on the bottleneck first.
- Build for Fast Rollback: The single highest-leverage improvement is automated rollback. If you can undo a bad deploy in seconds, your resolution time collapses.
- Simulate Failure: Run a "Game Day" where you simulate a failure (e.g., server crash) and measure your recovery time.
- Practice Failure: Run chaos experiments. Simulate outages. Practice your recovery process monthly. Muscle memory saves hours during real incidents.
- Invest in Observability: You can't diagnose what you can't see. Build dashboards that show the state of every critical flow (Law 5).
Signs You Are Violating This Law
- The "Pray It Works" Deploy: You're terrified of shipping because you have no confidence you can recover from a failure.
- The "Manual Recovery Dance": Every incident requires 5 people on a Zoom call manually coordinating fixes.
- The "Firefighting Culture": Your team is constantly in "crisis mode" because every failure takes hours to resolve.
- The "Uptime Theater": You brag about 99.9% uptime, but when you go down, customers flee.
How This Law Ties to Valuation
Law 9 impacts valuation in two ways:
1. Lower Operational Risk = Lower WACC
From Law 8, we know that internal operational risk raises WACC. High MTTR signals operational fragility—investors see this as risk. Low MTTR signals operational maturity, which lowers WACC and increases enterprise value.
2. Higher Resilience = Premium Multiples
Acquirers pay premiums for businesses that can weather disruptions. A company with proven low MTTR (documented incident recovery times) demonstrates resilience, which de-risks the acquisition and justifies higher multiples.
Closing Narrative
Imagine two boxers.
Boxer A has never been knocked down. He's undefeated. But he's also slow—he avoids risky moves because he's terrified of getting hit.
Boxer B has been knocked down 50 times. But every time, he gets back up in seconds. He's fast, aggressive, and fearless because he knows that even if he gets hit, he'll recover instantly.
Who wins? Boxer B. Every time.
Because resilience isn't about avoiding the punch—it's about getting back up faster than your opponent can capitalize on the knockdown.
In business, speed of recovery is the competitive moat.
Measure your bounce-back time. Optimize it. Dominate.